Introduction: The Evolution of Mobile Observability
In the rapidly evolving landscape of mobile development, delivering a seamless user experience is no longer a luxury—it is a strict requirement. As detailed in recent React Native News, the ecosystem is shifting from simple crash reporting to comprehensive observability. Developers are no longer satisfied with merely knowing that an app crashed; they need to understand the specific sequence of user interactions and network requests that led to the event. This demand has given rise to the concept of “auto-instrumentation,” a technique that is revolutionizing how we monitor applications built with libraries like React Native Elements.
Traditionally, tracking user behavior required manual logging. A developer would have to insert tracking code into every `onPress` handler or `useEffect` hook. This approach is error-prone, clutters the codebase, and often leads to “blind spots” where critical interactions go unmonitored. With the latest advancements discussed in Expo News and the broader community, performance platforms are now capable of automatically detecting UI elements and web requests straight out of the box. This article explores the technical mechanisms behind auto-instrumentation, how it integrates with popular UI kits, and how to implement robust monitoring strategies in your React Native applications.
The Core Mechanics of Auto-Instrumentation
Auto-instrumentation in React Native works by intercepting calls at the bridge or the JavaScript thread level. Instead of manually wrapping every component, modern monitoring tools utilize techniques such as Higher-Order Components (HOCs), Babel plugins, or monkey-patching core React Native primitives to listen for events.
Understanding the UI Hierarchy
When you use a library featured in React Native Elements News or NativeBase News, you are essentially assembling a tree of components. Auto-instrumentation tools traverse this tree. When a user interacts with a button, the instrumentation layer captures the event, the component ID, and the screen name (often derived from React Navigation News updates) without explicit developer intervention.
This is particularly vital for complex applications where state management is handled by libraries found in Redux News, Recoil News, Zustand News, or Jotai News. Understanding how state changes correlate with UI freezes requires granular visibility into the component render cycle.
Below is a conceptual example of how one might manually implement a simplified version of UI instrumentation using a Higher-Order Component. This illustrates the logic that auto-instrumentation tools abstract away.
import React, { useEffect, useRef } from 'react';
import { TouchableOpacity, Text } from 'react-native';
// A simplified instrumentation HOC
const withAutoTracking = (WrappedComponent, componentId) => {
return (props) => {
const { onPress, ...otherProps } = props;
const handlePress = (event) => {
const timestamp = Date.now();
console.log(`[AutoTrack] Interaction detected on: ${componentId} at ${timestamp}`);
// In a real scenario, this data is sent to a monitoring service
// potentially correlating with network requests
if (onPress) {
onPress(event);
}
};
return (
console.log('Login Pressed')}>
Login
);
};
export default App;In professional platforms, this wrapping happens automatically at build time or runtime, ensuring that components from Tamagui News or React Native Paper News are tracked without changing the source code.
Bridging the Gap: Network Request Monitoring
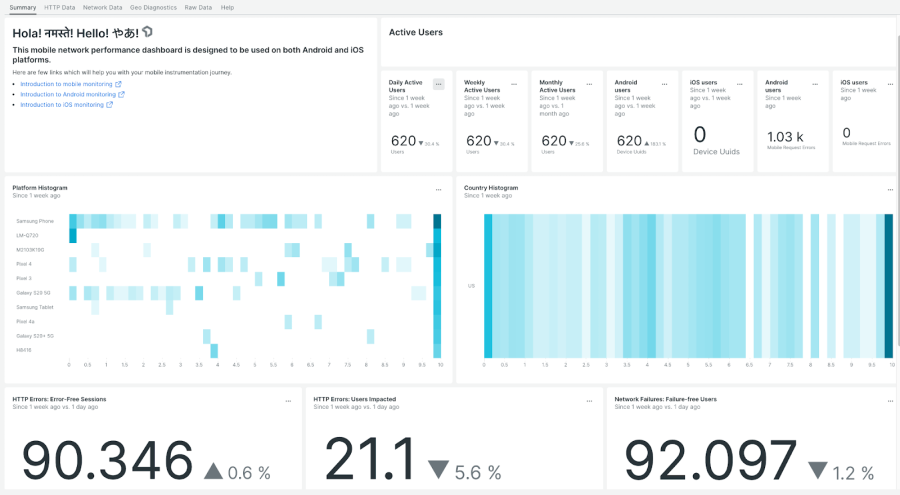
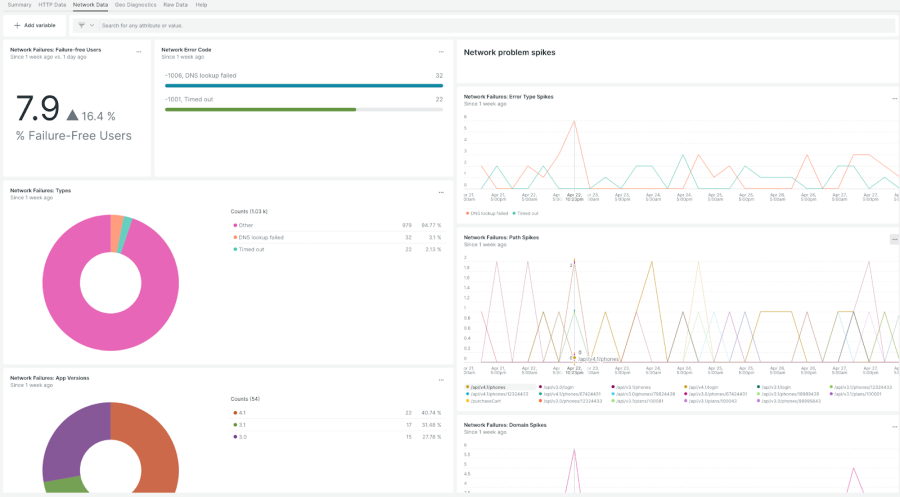
A beautiful UI is useless if the data doesn’t load. One of the most significant breakthroughs in recent React News is the ability to correlate UI interactions directly with the network requests they trigger. When a user taps “Refresh,” and the app hangs, is it a main-thread blockage or a slow API response?
Intercepting Fetch and XHR
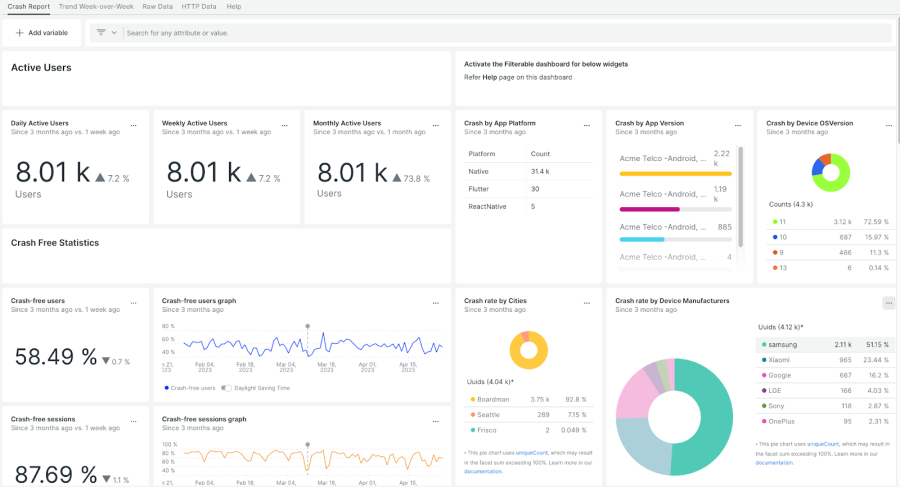
To achieve full visibility, monitoring tools must intercept `fetch` and `XMLHttpRequest`. This is crucial for applications relying on Apollo Client News, Relay News, or React Query News (TanStack Query). By wrapping these network primitives, the instrumentation layer can measure the “Time to First Byte,” payload size, and HTTP status codes.
This is similar to how server-side frameworks discussed in Next.js News, Remix News, or Razzle News handle OpenTelemetry, but adapted for the constraints of the React Native bridge.
Here is an example of how network interception is architected in a React Native environment to capture performance metrics:
// Conceptual Network Interceptor
const originalFetch = global.fetch;

global.fetch = async (...args) => {
  const [url, options] = args;
  const startTime = performance.now();
  const method = options?.method || 'GET';

  try {
    const response = await originalFetch(...args);

    const endTime = performance.now();
    const duration = endTime - startTime;

    // Log the successful request metric
    console.log(`[Network] ${method} ${url} - ${response.status} (${duration.toFixed(2)}ms)`);

    // Here you would dispatch this metric to your analytics store
    // potentially integrating with state from MobX News or Redux

    return response;
  } catch (error) {
    const endTime = performance.now();
    console.error(`[Network] FAILED ${method} ${url} - (${(endTime - startTime).toFixed(2)}ms)`);
    throw error;
  }
};

// Now, any library like Urql News or standard fetch calls
// will be automatically logged.
This level of insight allows developers to pinpoint exactly which microservice is causing latency in the mobile app, a topic frequently debated in Blitz.js News and RedwoodJS News circles regarding full-stack performance.
Advanced Techniques: Monitoring Animations and Gestures
React Native is famous for its fluid animations, powered by libraries seen in React Native Reanimated News, React Spring News, and Framer Motion News. However, animations are resource-intensive. Auto-instrumentation needs to be sophisticated enough to detect frame drops (jank) without causing them.
The Challenge of the JS Bridge
When using React Native Maps News or complex charts from Victory News and Recharts News, the communication between the JavaScript thread and the Native UI thread is heavy. Advanced monitoring tools hook into the `MessageQueue` to measure the congestion on the bridge.
If you are building a complex form using React Hook Form News or Formik News, input lag can be detrimental. You can implement performance boundaries to measure the render cost of specific complex components.
The following TypeScript example demonstrates creating a performance boundary component that utilizes the `performance` API to track render times of its children, which is essential when optimizing heavy lists or complex React Native Elements structures.
import React, { Profiler, ComponentType } from 'react';
import { View } from 'react-native';

interface PerformanceBoundaryProps {
  id: string;
  children: React.ReactNode;
}

const onRenderCallback = (
  id: string, // the "id" prop of the Profiler tree that has just committed
  phase: "mount" | "update", // either "mount" (if the tree just mounted) or "update" (if it re-rendered)
  actualDuration: number, // time spent rendering the committed update
  baseDuration: number, // estimated time to render the entire subtree without memoization
  startTime: number, // when React began rendering this update
  commitTime: number // when React committed this update
) => {
  if (actualDuration > 16.67) {
    console.warn(`[Slow Render] ${id} took ${actualDuration.toFixed(2)}ms (${phase}) - Potential Frame Drop`);
  }
};

export const PerformanceBoundary: React.FC = ({ id, children }) => {
  return (


        {children}


  );
};

// Usage: Wrapping a complex list
// <PerformanceBoundary id="UserFeed">
//   <FlatList ... />
// </PerformanceBoundary>
Integration with Testing and Build Tools
Implementing observability is not just about production monitoring; it starts in the development and testing phase. Jest News and React Testing Library News have long emphasized the importance of testing behavior over implementation details. Auto-instrumentation aligns with this philosophy by treating the app as a black box.
When running end-to-end tests with tools discussed in Detox News, Cypress News, or Playwright News, having unique IDs automatically generated for UI elements can significantly stabilize flaky tests. Instead of manually adding `testID` props to every React Native Elements button, auto-instrumentation plugins can inject them based on the component name or file structure.
Build-Time Configuration
Modern build tools like those mentioned in Vite News (for web) and Metro (for React Native) allow for plugin injection. By configuring your `babel.config.js`, you can strip out heavy instrumentation logic in production or enable detailed tracing in debug builds.
// babel.config.js example for conditional instrumentation
module.exports = function(api) {
  api.cache(true);

  const plugins = [
    // Standard Reanimated plugin
    'react-native-reanimated/plugin',
  ];

  if (process.env.NODE_ENV === 'development') {
    // Add a hypothetical auto-instrumentation plugin only in dev
    // This helps debug render cycles without bloating the prod bundle
    plugins.push(['babel-plugin-react-native-performance-monitor', {
      logComponents: ['Button', 'ListItem', 'Map'],
      threshold: 16 // ms
    }]);
  }

  return {
    presets: ['babel-preset-expo'],
    plugins: plugins,
  };
};
Best Practices for Performance Monitoring
While the allure of “auto-instrumenting everything” is strong, it requires a strategic approach to avoid performance degradation and data overload. Here are key best practices derived from React Native News and industry standards.
1. Sampling and Data Volume
You do not need to track every single scroll event for every user. High-frequency events can flood your analytics pipeline and drain the user’s battery. Implement sampling rates. For example, capture detailed traces for only 5% of sessions, but capture 100% of crashes. This balance is often discussed in Gatsby News regarding web performance, but it applies strictly to mobile as well.
2. Privacy and PII Sanitization
Auto-instrumentation might accidentally capture sensitive data. If you have an input field from React Native Paper News labeled “Password” or “Credit Card,” your monitoring tool must automatically redact this text. Ensure your configuration explicitly excludes text content from input fields unless necessary.
3. Contextualizing Errors
An error trace is only as good as its context. Ensure your instrumentation captures the navigation state. If a user crashes on the “Checkout” screen, knowing they came from “Cart” vs. “Deep Link” is vital. Integration with React Router News or React Navigation state persistence is essential here.
4. Monitoring Hybrid Apps
Many modern apps are hybrid, utilizing WebViews. If you are using approaches discussed in Ionic News or embedding web content, ensure your instrumentation bridges the gap between the Native layer and the WebView. The context must flow seamlessly between the two environments.
Conclusion
The landscape of React Native development is maturing. We are moving past the days of guessing why an app feels slow or why a specific button press causes a crash. The ability to fully auto-instrument UI elements and web requests straight out of the box represents a significant leap forward in mobile observability. By leveraging these advanced monitoring techniques, developers can gain deep insights into how users interact with components from libraries like React Native Elements, Tamagui, and NativeBase.
Whether you are managing state with tools from MobX News or Redux News, or handling complex data fetching with Urql News, the visibility provided by auto-instrumentation ensures that performance bottlenecks are identified and resolved quickly. As tools continue to evolve—mirroring the rapid pace of React News—the gap between native performance and developer visibility will continue to close, leading to higher quality, more resilient mobile applications.
The next step for your team is to evaluate your current monitoring stack. Are you manually logging events? Are you blind to network latency? Adopting an auto-instrumentation strategy is not just about fixing bugs; it’s about understanding your users and delivering the seamless experience they expect.


